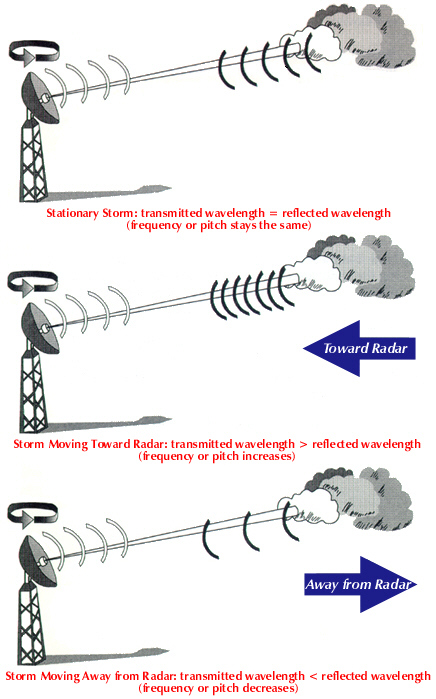
Figure 1.1. Doppler Radar and relationship to detection and movement of clouds and moisture.
Figure 1.1.a Doppler Radar reflecting back from droplets of moisture, rain, or snow.
Lab 6-4 Wx Observations Using the Internet
BACKGROUND INFORMATION 1
Doppler Radar
Doppler radar is a valuable tool for weather forecasters, research
scientists, and air traffic controllers. Doppler weather radar differs from
conventional weather radar because it can detect not only where a storm is
located, but also how fast air inside the storm is moving. National Weather
Service Doppler radars transmit pulses of radio waves at a wavelength of
approximately 10 cm (centimeters), about the same as those used to cook food in
a microwave oven. Water droplets in the air reflect the pulses. Some of the
radio energy returns to the Doppler radar, where it creates a picture of a storm
and how it is moving.
More than 150 years ago, a young scientist named Christian Doppler explained
this effect. Doppler was studying the motion of waves and predicted that the
frequency of a wave (for example, the pitch of a note) would change depending on
whether the source of the sound moved toward or away from you. To test the idea,
an engineer blew the whistle on a railroad train while an observer standing by
the side of the tracks listened to the whistle's pitch as the train approached,
passed, and moved away. What Doppler predicted, and the observer confirmed, was
that the frequency (pitch) of the source (the whistle) increased or rose as the
train approached and decreased or fell as it moved away. More than 50 years
later, Albert Einstein demonstrated that this phenomenon, called the Doppler
Effect, was also true for electromagnetic waves.
The antenna of a Doppler radar is called a "dish" because of its shape. The
radar dish constantly moves (or scans) in a circle at angles between 1 degree
and 20 degrees above the horizon. While it scans, the radar sends out radio
pulses and listens for the return signal reflected from airborne particles.
The Doppler radar can detect small changes in the frequency of the returned
signal as precipitation moves either toward or away from the radar. Droplets
moving with the air are a good indicator of wind speed in a storm. When the air
moves away from the radar, the frequency of the returned signal is lower than
the transmitted signal, just as the pitch of a train whistle appears to fall as
the train moves away from you. When the air moves toward the Doppler radar, the
frequency of the returned signal is higher. Try to imagine how the frequency and
wavelength of the reflected radar signal changes depending on how the storm in
Figure 1-1 is moving.
Figure 1.1.a Doppler Radar reflecting back from droplets of moisture, rain, or snow.
Police traffic radars work in the same way.
The location of a storm or cloud is detected by the strength or intensity of the
radar signal reflected from the water in it. The higher the moisture content in
a region of a storm or cloud, the greater its intensity, or reflectivity.
Therefore, Doppler radar not only shows the location of the storm, but it can
also show where in the storm most of the moisture is located. For these reasons,
Doppler radar is especially good at detecting severe weather, such as hail
storms or tornados. On the radar screen, hail appears as the most dense, rain is
less dense, and snow is least dense. Airplanes and swarms of insects also
reflect radar waves, but experienced forecasters can easily tell the difference.
The data for this activity were collected from the Mile High Doppler radar site
east of the former Stapleton International Airport in Denver, Colorado. The
radar image shown in Figure 1-2, was generated by analyzing the Doppler pitch of
a winter storm that occurred on March 9, 1992, at 9:45 pm.
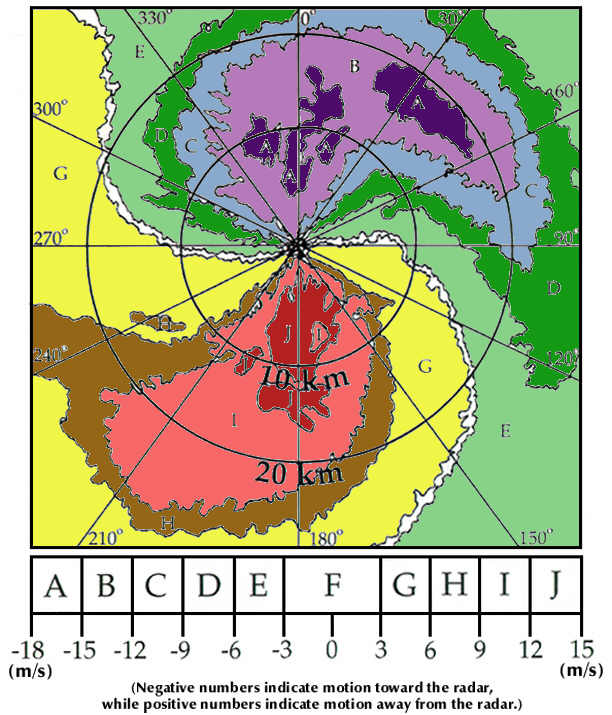
Section A = Dark Purple or Violet (The greatest
negative Doppler pitch indicates a storm moving towards the Radar.)
Section B = Light Purple or Violet
Section C = Light Blue
Section D = Dark Green
Section E = Light Green
Section F = No Color or White
Section G = Yellow
Section H = Brown or Orange
Section I = Light Red
Section J = Dark Red (The greatest positive Doppler pitch indicates a storm
moving away from the Radar.)
The storm dropped large amounts of snow on Denver and the surrounding area.
In the worksheet for this activity, you are looking at the motion of the
snowflakes as recorded by the Doppler radar. This view is different from the
view of storm intensity broadcast during daily television weather reports,
because it can detect storm movement.
Meteorologists, as well as astronomers and other physical scientists, use the
color blue or violet to indicate movement toward the radar and the color red to
indicate movement away from the radar. The Doppler Radar Worksheet provides the
pattern of Doppler velocities that covers a radius of approximately 20 km around
the Mile High Doppler radar site.
All images and content courtesy NOAA.gov